B.C.’s ESG Advantage

Why choose B.C.
British Columbia provides a welcoming environment that actively encourages investment. It has a world-renowned legal system, top-ranked quality of life, and a diverse and skilled workforce. The Province is committed to ESG and leading on environmental and social responsibility—helping to grow an economy that is inclusive, sustainable and innovative.
Learn more about B.C.’s trade and investment advantages at britishcolumbia.ca.
Martin Knowles | Photo courtesy of naturallywood.com
ESG in B.C.
The province of British Columbia is known for its incredible natural beauty, dedication to sustainability, business innovation and strategic economic growth. Increasing and maintaining this commitment is not only at the heart of the success of our province, but it also supports our core values as British Columbians.
Diverse groups, individuals, businesses, communities and Indigenous Peoples are aligning and partnering to lead, inspire and expand an economy that is environmentally, socially and economically aware and connected.
Learn about consulting with Indigenous Peoples and First Nations communities in British Columbia.
Martin Knowles | Photo courtesy of naturallywood.com

ESG in action
B.C. businesses are leading the way in offering environmentally and socially responsible goods and services.
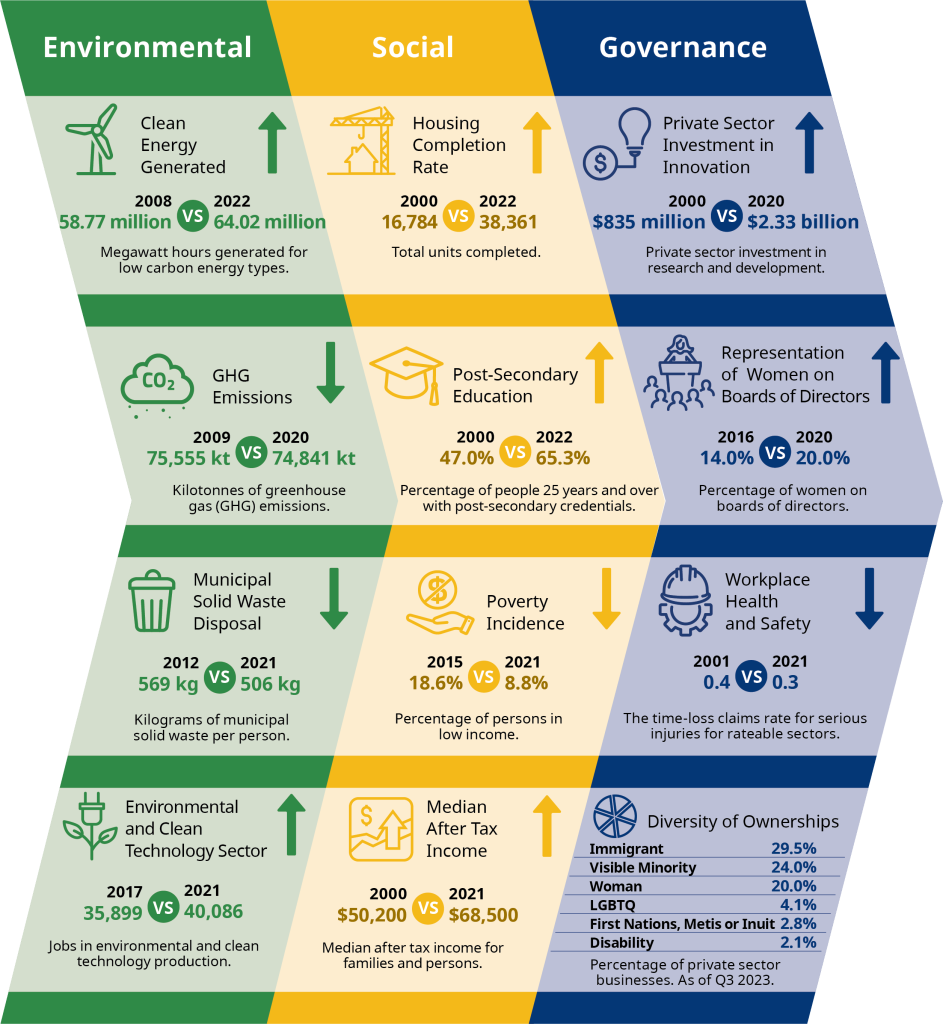
B.C.’s ESG data trends snapshot
This trends snapshot provides metrics that showcase
how B.C. is positioned in the ESG landscape.

Accessible information from snapshot
Data Sources: Statistics Canada; Environmental Reporting BC; & WorkSafeBC – January 2024
ESG in British Columbia
Read about how B.C. is creating an economic and investment climate that is environmentally, ethically and economically conscious.
ESG summary report
This summary, released by the Ministry of Finance, provides an overview of the government’s Environmental, Social and Governance (ESG) credentials and initiatives.
ESG supplementary data
This data is supplementary to the Summary Report and provides metrics that highlight how government incorporates ESG values into its programs, policies and legislation.

